Tales from the Tesla

Phil Bixby

Facebook
Twitter
LinkedIn
Email

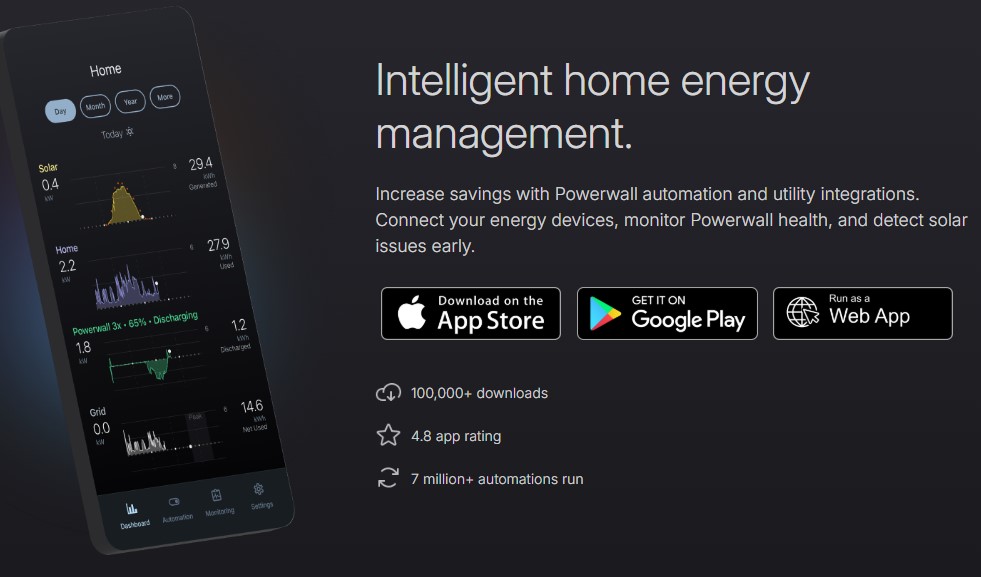
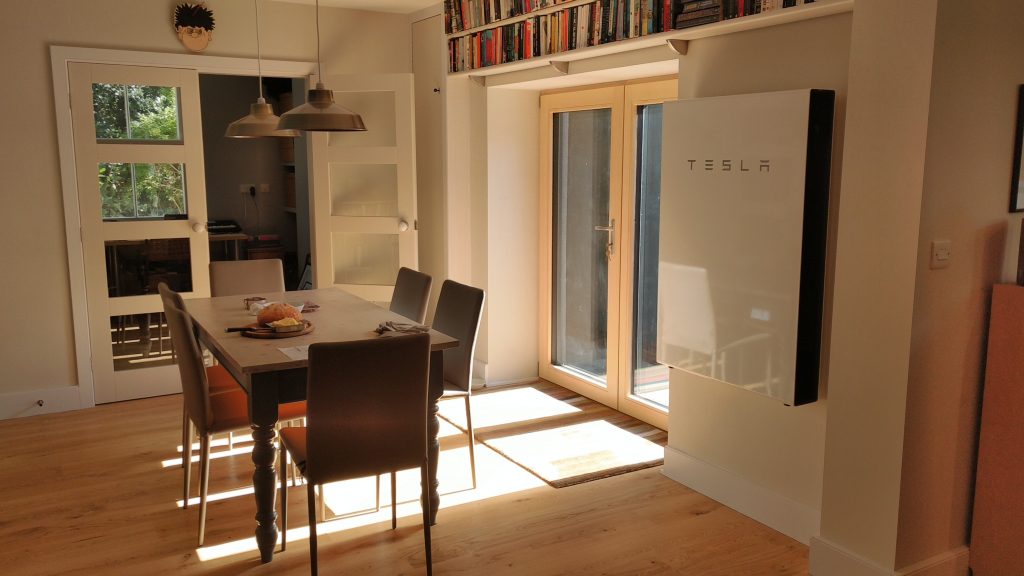
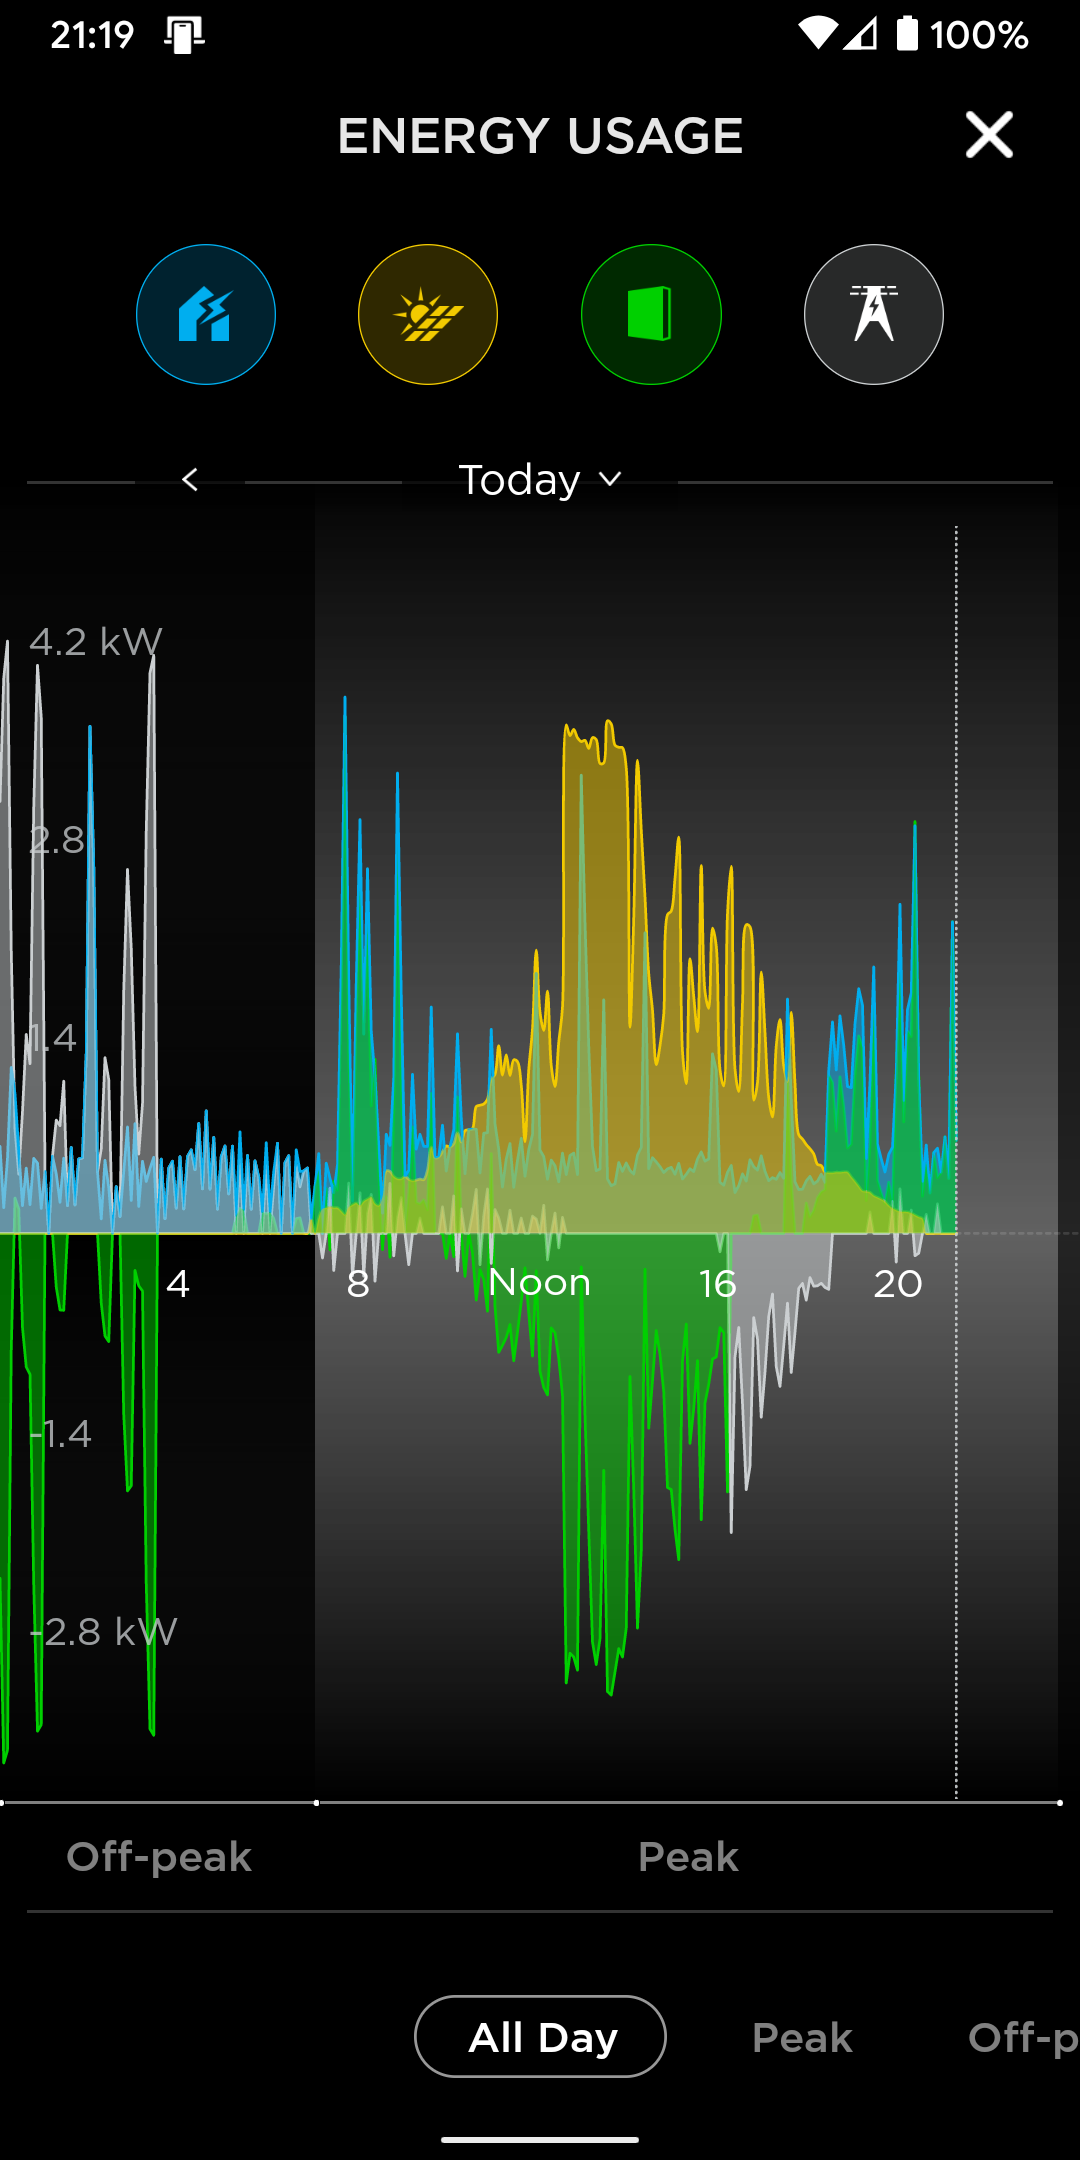
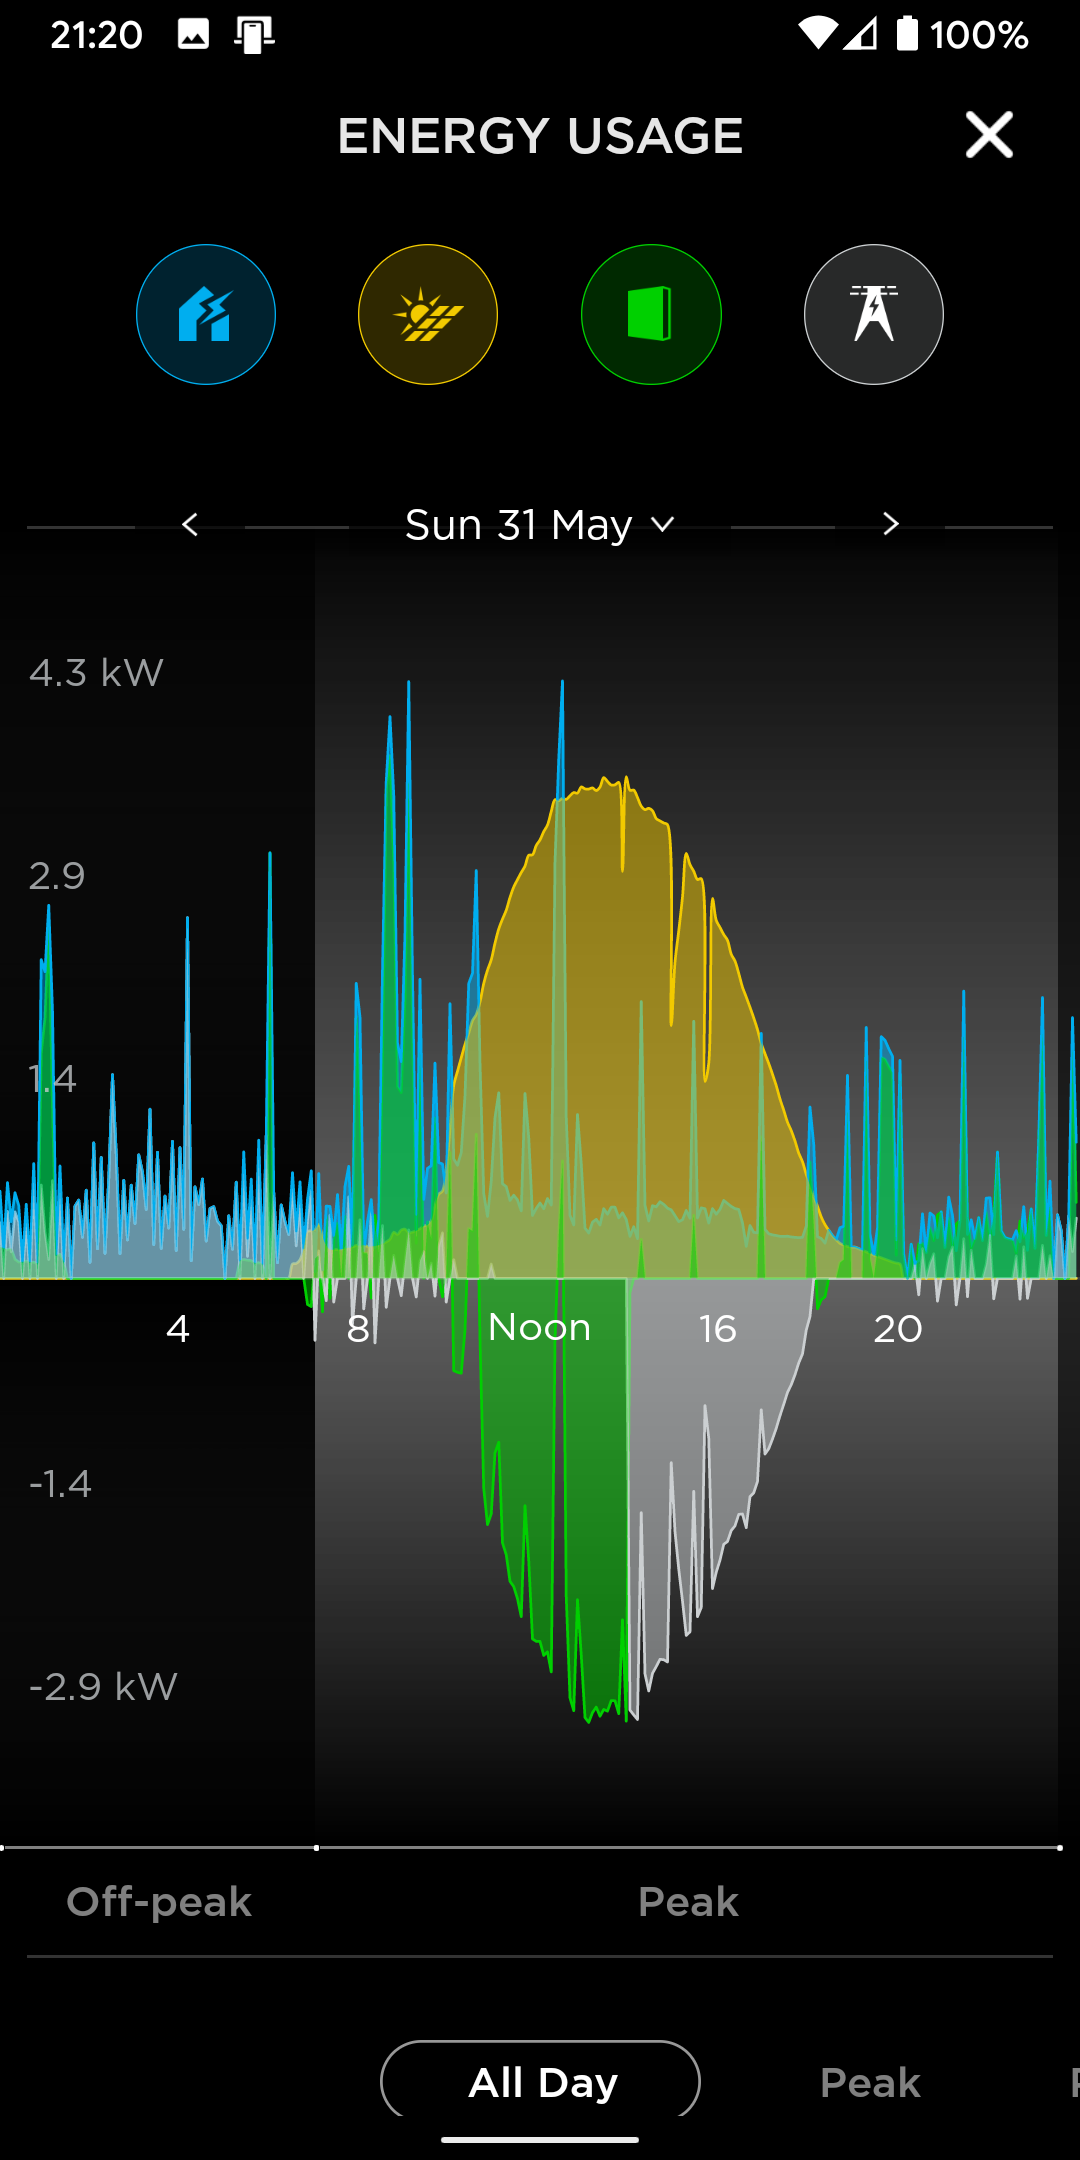
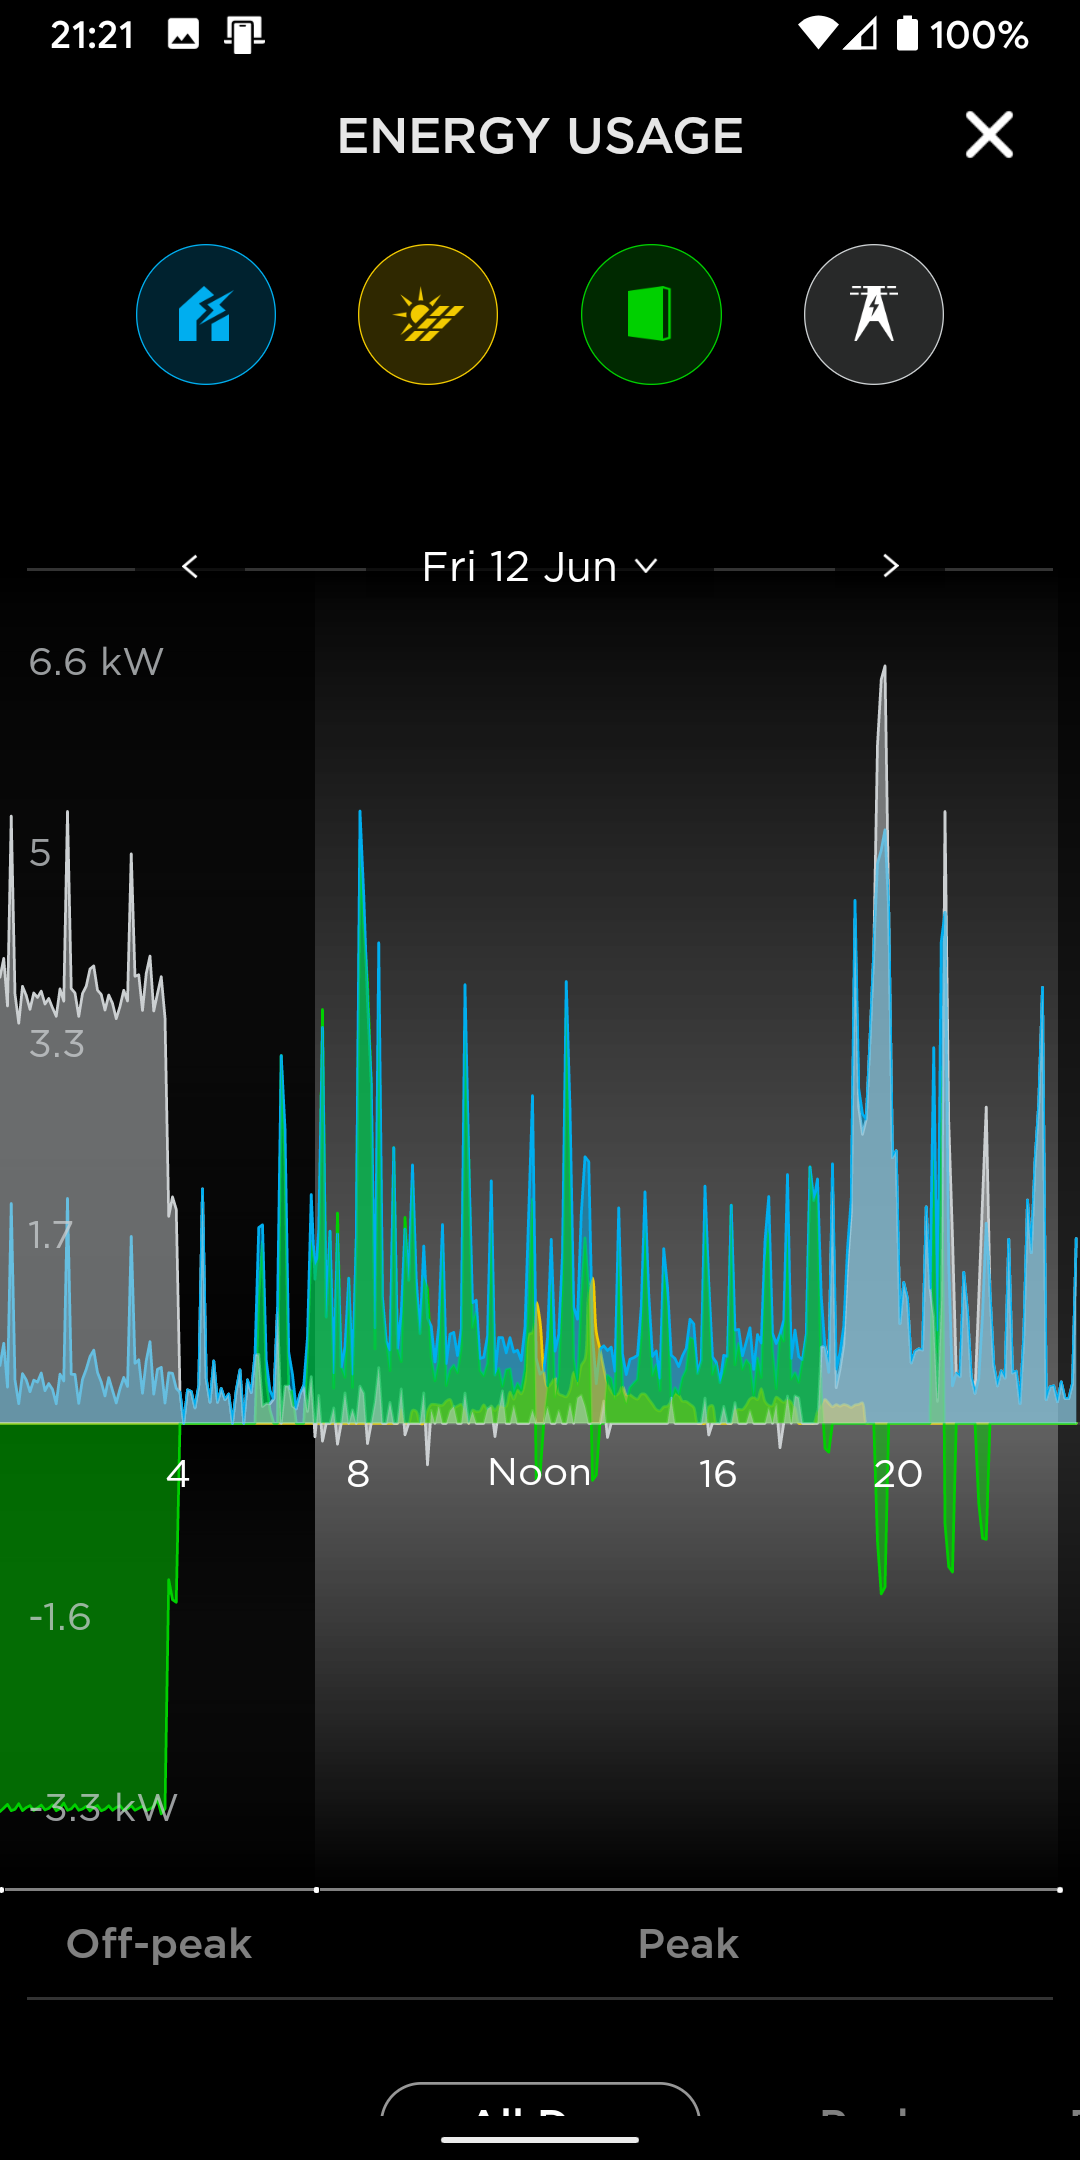
The Tesla Powerwall is pretty much a fit-and-forget piece of kit – beyond an isolator it has no physical controls and it just sits more or less silently on the wall, pulsing with green neon light when it’s doing something useful like charging or discharging. But the battery links to a phone app. In addition to allowing setting of off-peak charging hours, this allows monitoring of the system as a whole, given everything’s connected to the battery. So, it shows battery status but also domestic use, PV output, and mains use.

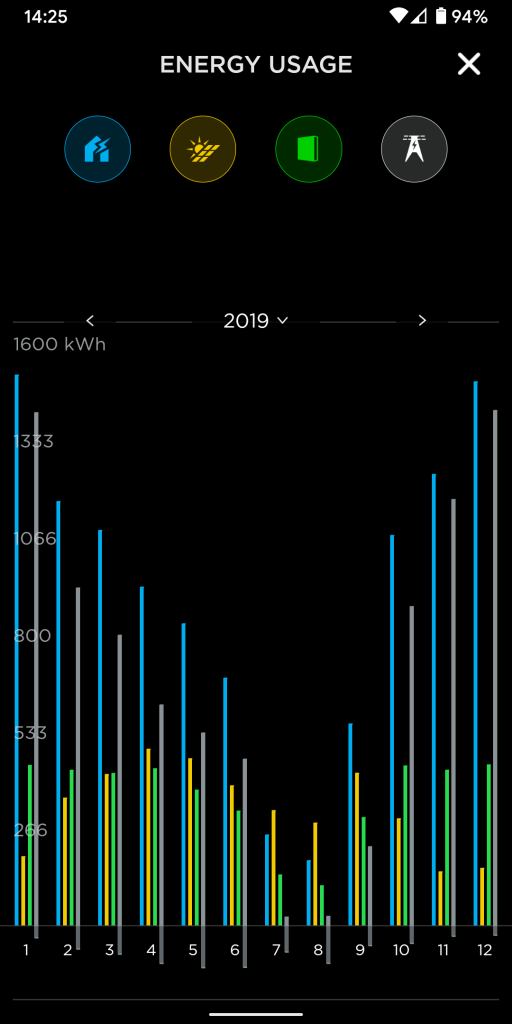
Over the past year Tesla have updated the app a few times and it now gives some very useful options. All historic information is available – pretty much on a day-by-day basis and it can be downloaded for analysis. Simply interrogating the app gives some interesting stats though. Taking our own installation, we’ve been here a little over eighteen months now. So – with the exception of a few weeks last summer when the system was down (due to a blown fuse, as it transpired. We Don’t Get Fooled Again) we have a full year’s figures (2019, above).

As is clear, the situation varies wildly between the seasons. In winter we’re using a lot more space heating (although, reassuringly, very much in line with PHPP predictions) and getting less sun. In summer there’s a three-month period where we’re producing more than we’re using (although performance for this period would have in reality been better as this was when the system was offline for a while).

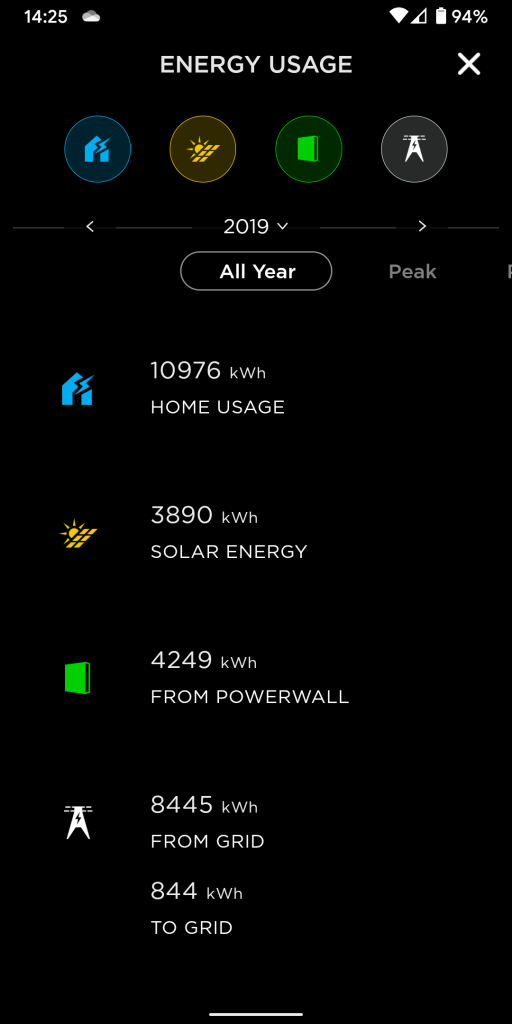
Overall, the figures are as above. PHPP predicted annual space heating of 6731kWh so that home usage figure – including cooking / lighting / office / electric bike etc – looks about right. Almost exactly a third of this came from the sun (wooohooo!) and slightly more came via the Powerwall. The app seems to be wrongly reporting the annual split between peak / off-peak, but checking this on a month-by-month basis gives around a one-quarter peak / three-quarters off-peak balance.

And… …after a bit more use, an update in June 2020. A gallery of one-day graphs showing what happens overall during different weather scenarios. I’ll talk you through them. 

The first, on the left, is from today – an overcast morning which almost-but-not-quite cleared by lunchtime, and a mild afternoon with a bit of cloud. We got 16kWh of solar and used 15kWh – most of the heating is either manually switched off or kept off by thermostats as external temps are up around 20c. You’ll see the Tesla was ambivalent about our prospects – spending a bit of time during the Economy Seven overnight period charging, but only half-filling the battery to allow capacity if the morning was sunny (it’s late evening now and the day has left the battery 75% full).

The next screenshot is from the sunny period a couple of weeks back. Pretty much no charging overnight, and a full day of sun brought in 22kWh of energy – more than the 17 we used – so a fair chunk was exported once the battery was full (that’s the grey chunk in the lower right).

The third image is during the recent poor weather – just 5kWh incoming from the well-hidden sun, and we used about 24kWh as the heating was kicking in to compensate for low temperatures outside. The Tesla wasn’t quite sure what to do – it took on a bit of Economy Seven overnight but less than half-filled. As a result we used about 12kWh of full-rate electricity during the day – not ideal. However…

…by the end of that ‘orrible week the Tesla could see what was coming; the last screenshot on the right shows a grotty day at the end of a string of grotty days. The Tesla pretty much filled up overnight, so although we only got 2kWh from the sun, we got 13 from the Powerwall, which took the sting out of the 26kWh whole-house consumption. You can see the point at which our consumption goes from green to grey – battery to grid – at about half six in the evening. Not bad.

Overall we’re still broadly getting between a third and half of all energy from the sun – May was around two-thirds, June so far around half. It certainly adds another dimension to noticing the weather, although with the view out of the windows onto the wildflowers, we’ve become pretty tuned in to it anyway!

Want more of this? You can navigate through other blogs on this site below, or follow me on Twitter @PhilBixby to find out when new stuff appears!

Leave a Reply

Your email address will not be published. Required fields are marked *